

Did you know there are over 175 different community indicators on Chelan-Douglas Trends - each updated throughout the year? But which ones, and when?
This issue of the Chelan-Douglas Trends blog lists the most recently updated indicators on the Chelan-Douglas Trends website.
This page will be updated and email alerts sent on a quarterly basis. Don't miss an update - subscribe today!
Recent Updates
In PEOPLE: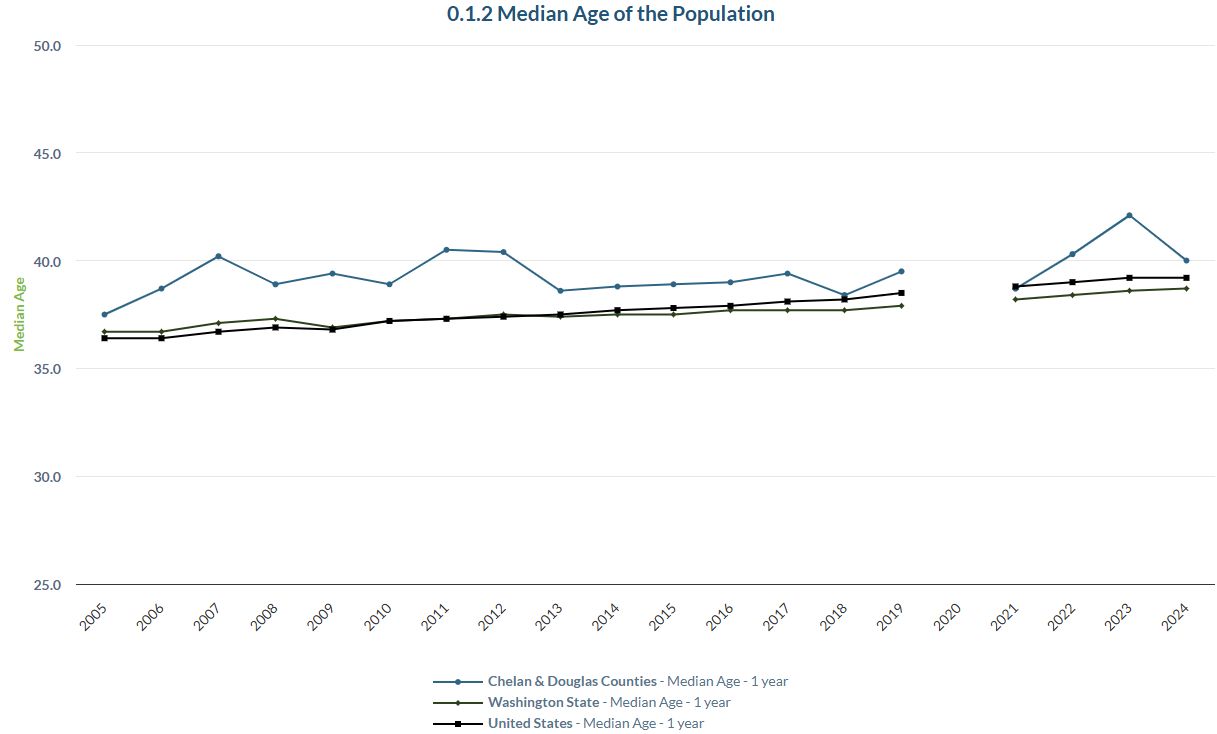
Median age in the two counties continues to be above benchmarks.
Median age is a summary measure that answers the question of the age structure of an area’s population with one number. Generally, a median is that middle value of a set of numbers that divides it into two equal parts.
For Chelan and Douglas Counties, that value has typically been above that of the U.S. and Washington. In 2024, for example, it was 40 years, versus 39.2 and 38.7 years of the U.S. and Washington state, respectively. The population here clearly is a bit older than these two broad benchmarks, but not by much. As Trends sister indicator on age reveals, the result is largely due to higher shares of the population taken by ages 40+ here.
In ECONOMIC VITALITY: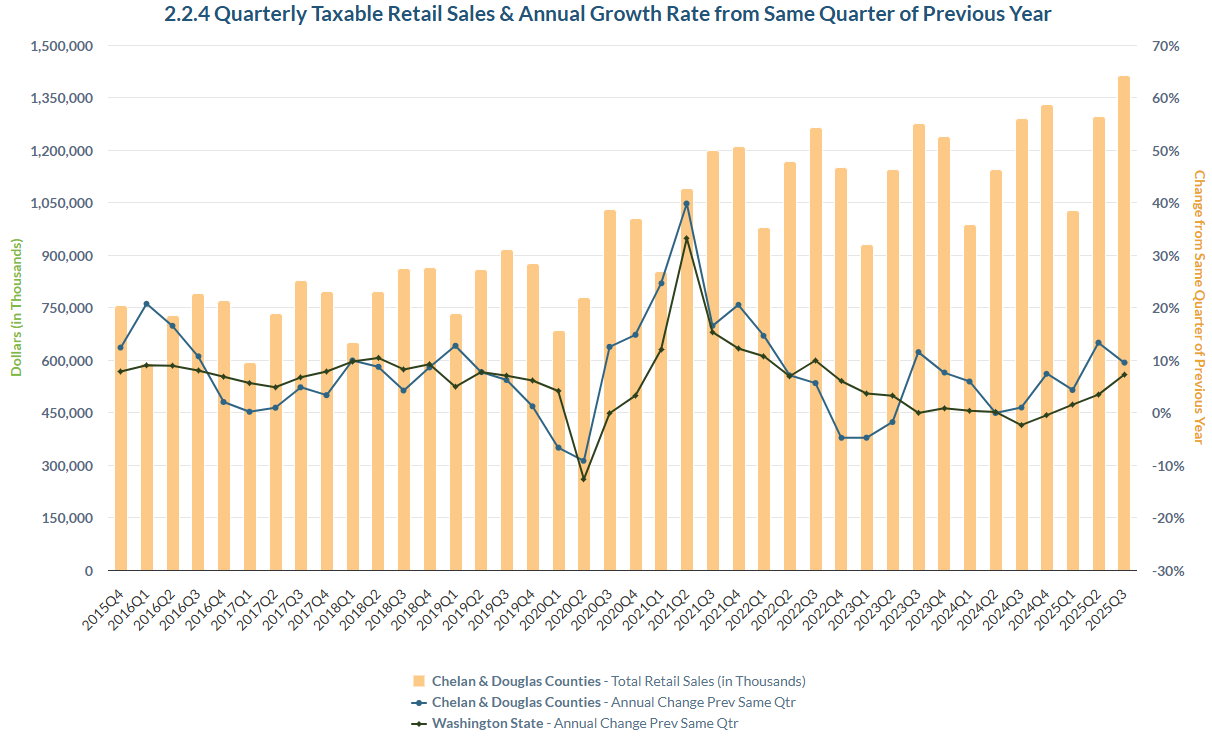
Quarterly taxable retail sales here have outpaced the growth statewide.
Since the middle of 2022, taxable retail sales registered in the two counties have outpaced those statewide. For the first three quarters of 2025, year-over-year increases of this key measure of local economic health in the two counties were: 4.2%, 13.3% and 9.5%.
While this measure of the local economy covers most retail trade activities, state law applies the tax to several other industries. Foremost among them is construction. It is the activities of this industry that appear to be responsible for the large increase of the second and third quarters of last year. Once the 4th quarter numbers are reported, it is likely that a sizeable year-over-increase will be recorded. And it is likely that construction activity will lie behind the bulk of the increase. 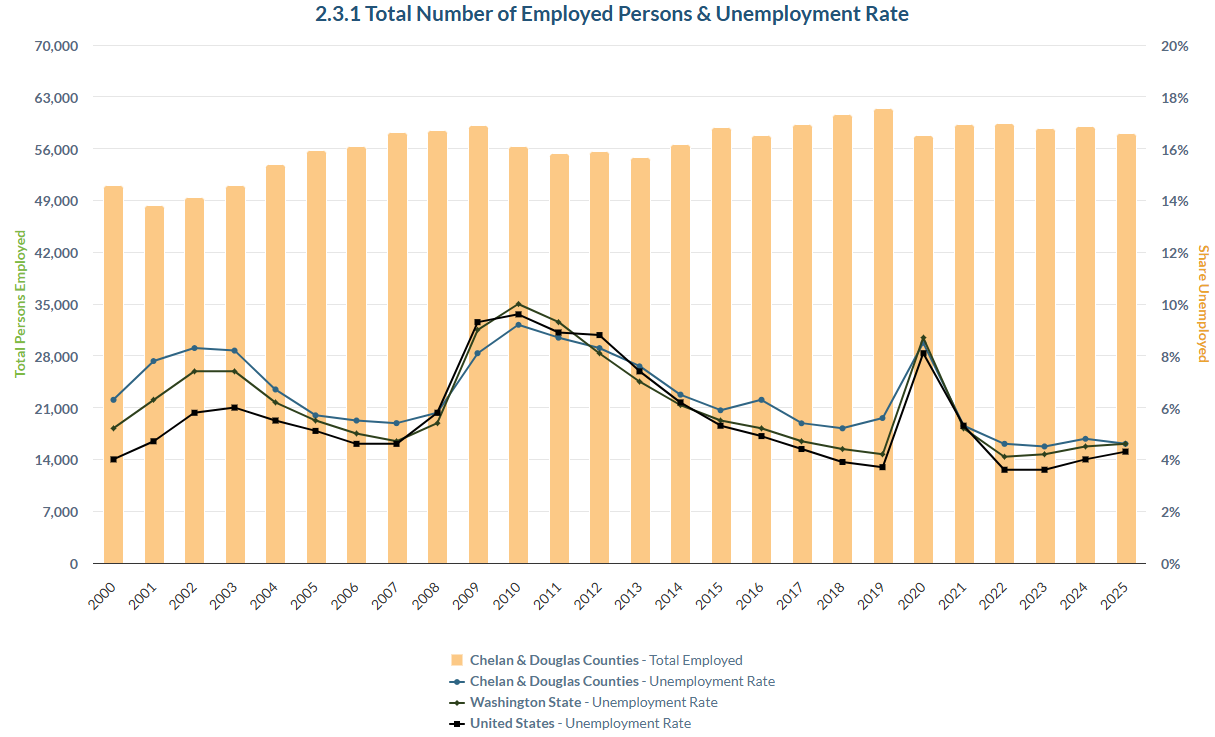
The number of residents of the two counties at work continued to shrink in 2025.
In 2019, over 61,300 residents were employed. By last year, that number had shrunk to 58,000. This doesn’t imply that the number of jobs provided by employers in the two counties has diminished. That count notched modest gains over the interval. Rather, this measure of employment refers to those living and working in the two counties. For the total count from employers located in the two counties, workers from other counties supplement the numbers of those living and working here. This measure also covers residents who commute, physically or virtually, to jobs in other counties or states.
Nonetheless, a shrinking number of residents who are employed points to a challenging trend: if the local economy continues to grow, then more workers will need either to move or commute here. 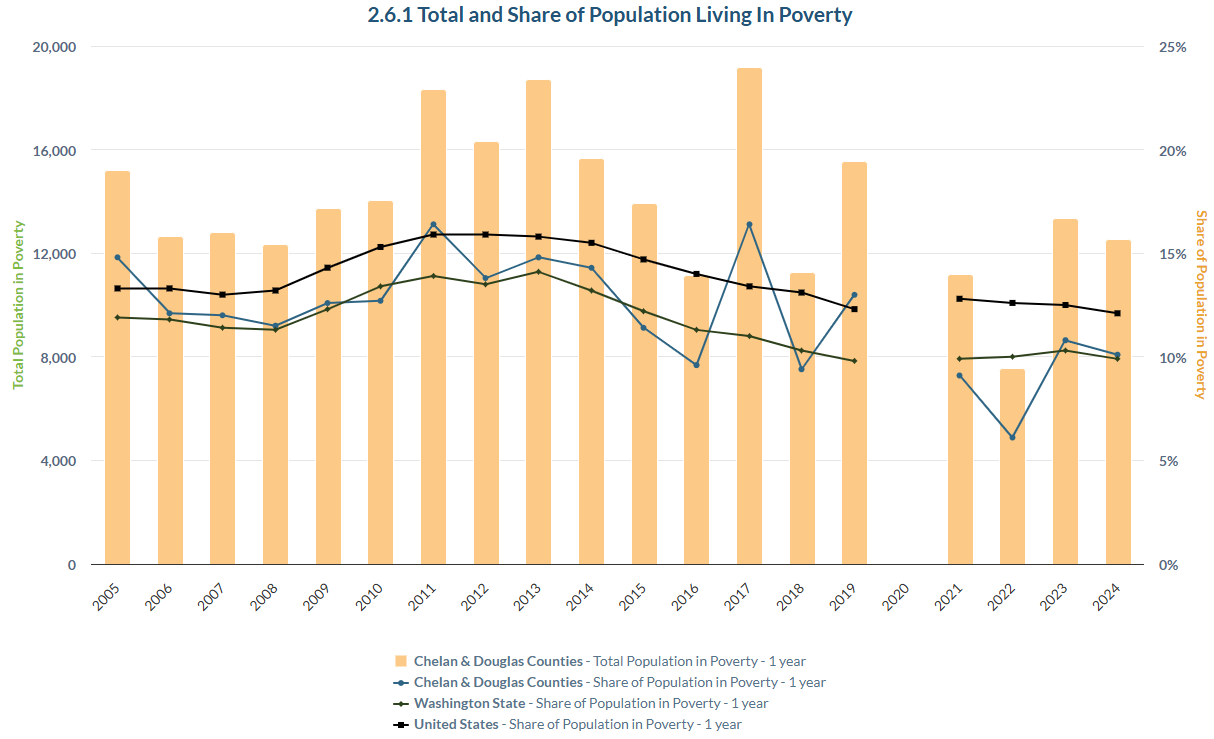
Poverty thresholds are set annually by the U.S. Census and change by the Consumer Price Index and well as by family size. For example, in 2024, the poverty threshold for a family of two adults and two children was $31,812. Below that amount, all four people are deemed to live “in poverty”; above it, not in poverty.
For the two counties, the estimated number of two-county residents living at or under the poverty line was about 12,500, or a rate of 10.1%. In pre-pandemic 2019, analogous numbers were 15,550 and 13%. For 2024, the local poverty rate was considerably below the U.S. rate and nearly identical to the Washington rate.
In ENVIRONMENT: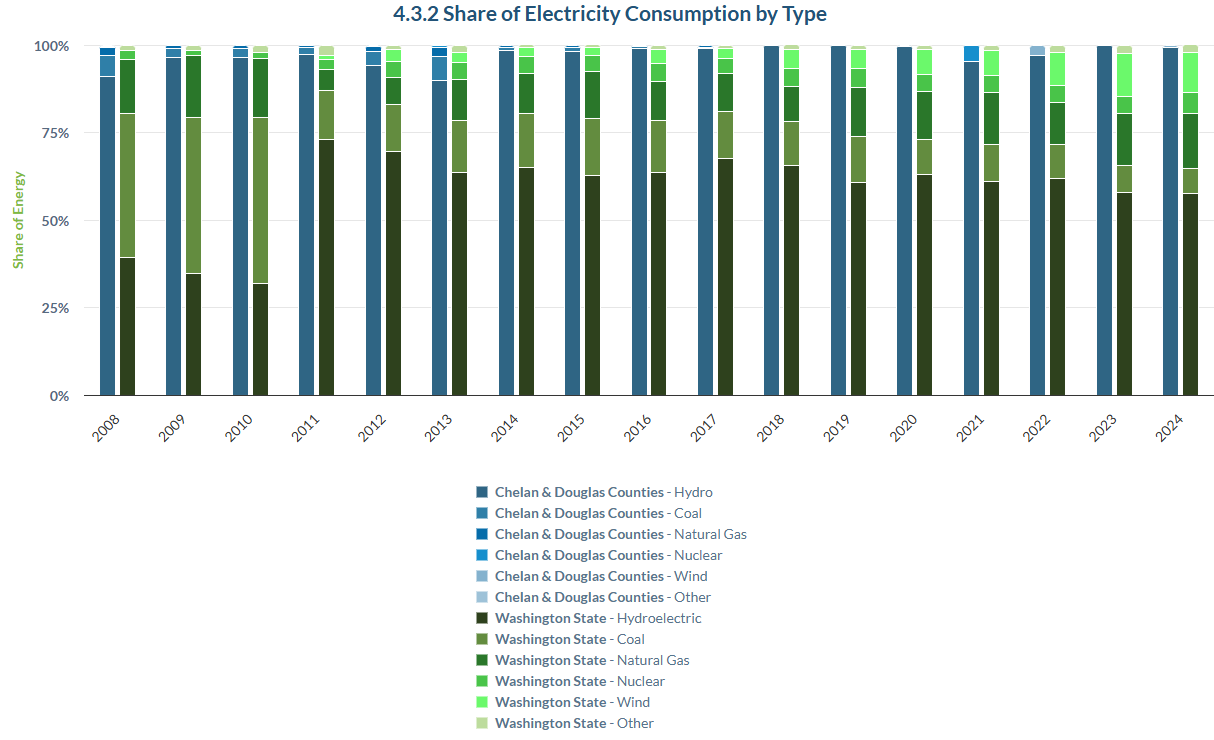
Electricity consumption here is, no surprise, all hydroelectric.
For three of the past 5 years (2020-2024), the source of electricity in the two counties was exclusively hydro. In the two other years, a small amount of nuclear and wind entered the mix.
As the indicator shows, this is vastly different mix than the statewide average. In 2024, for example, hydro amounted to 58%, followed by natural gas at 16%, then wind at 11%. Coal and nuclear shares landed a distant 4th and 5th statewide.
In HEALTH: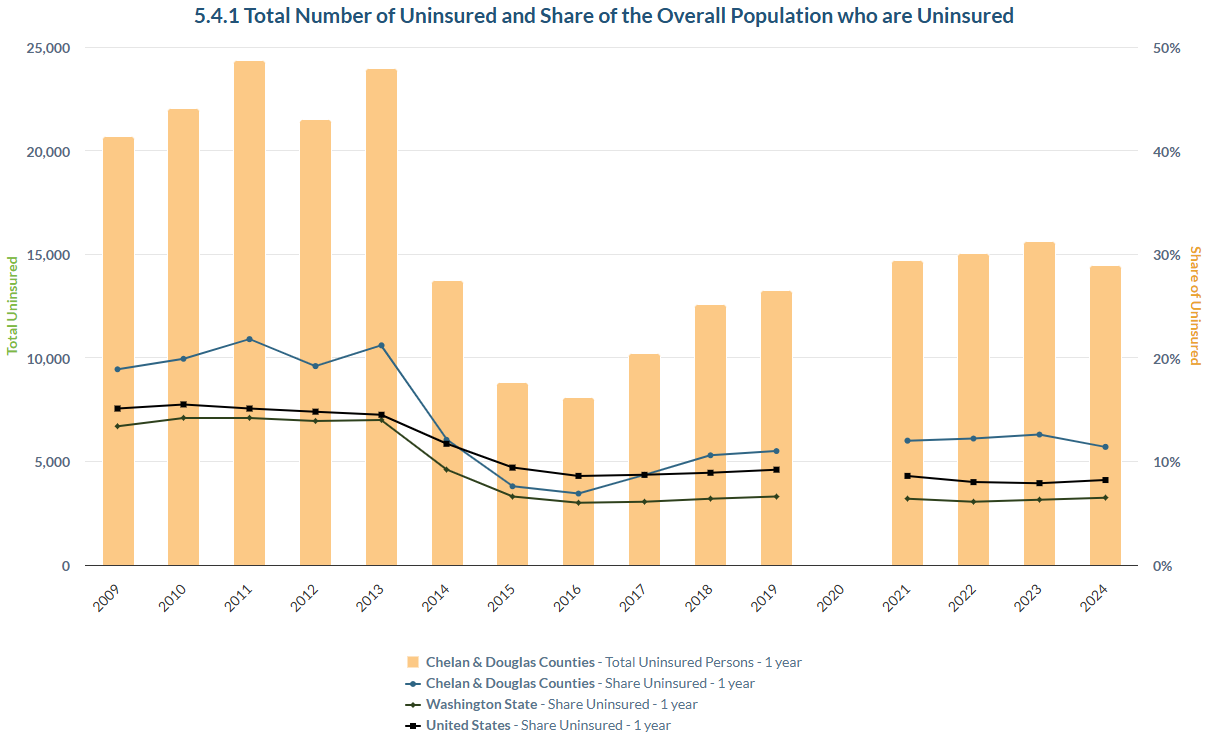
Good health depends on a welter of factors, many of which are not specifically health-based, such as housing, education and quality jobs. But healthcare does play a key role in population health. And one typically doesn’t access healthcare without insurance coverage.
This measure tracks residents without it. As the graph shows, at the onset of the Affordable Care Act, the numbers of two-county residents without health insurance plummeted – to a low of about 8,100 in 2016, or 6.9% of the population. Since then, they have risen. In 2024, the estimated number of residents without insurance was 14,500, or 11.4% of the population These are somewhat larger than in pre-pandemic 2019. And the rate is now (and has recently been) considerably above the nation and the state.
In HOUSING: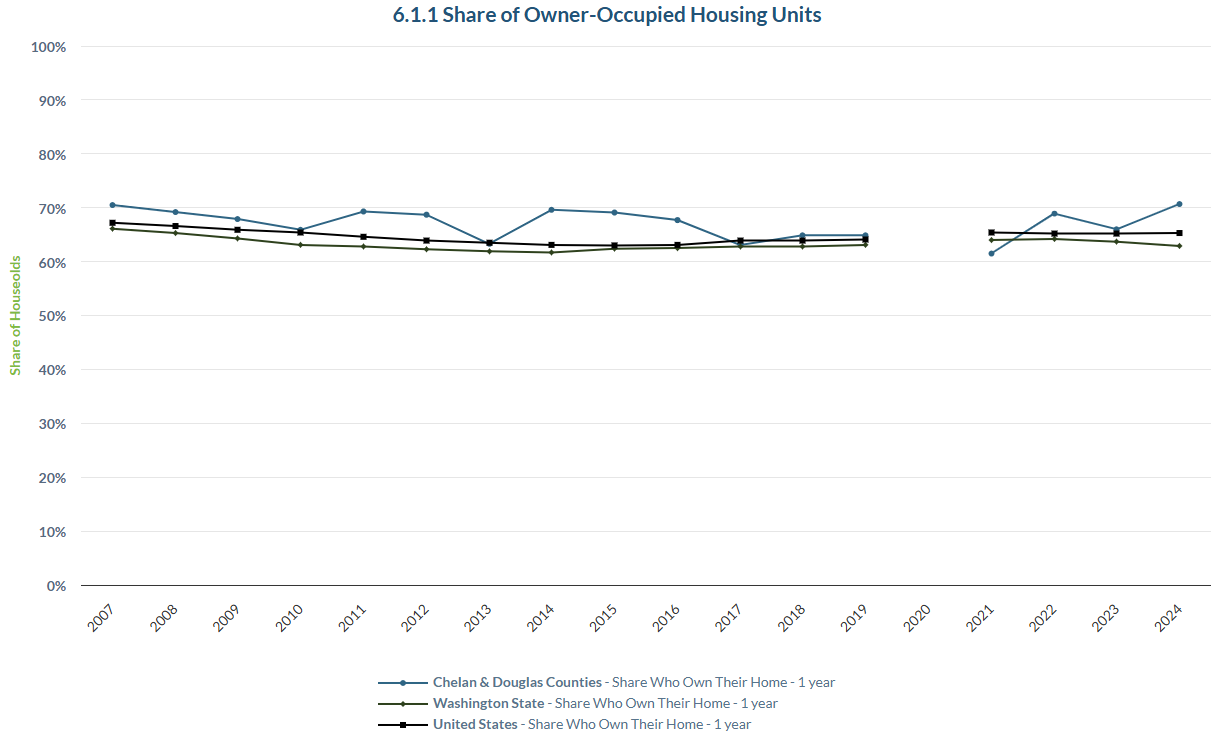
The share of all housing units that are owner occupied runs a bit high here.
Owning one’s home has been traditionally touted as a part of the “American Dream.” And home ownership is a key element, often the key, for a family wealth-building. By these measures, a large portion of residents of the two counties are living the dream and likely accumulating wealth.
As this indicator reveals, an estimated 71% of all housing units were owner-occupied. (Some may be rented, but this is a small percentage.) This rate for 2024 was higher than the one observed for the U.S. and the state. For most of the years captured by this indicator, this has been the case.
Of course, home ownership will positively track with the age of the population. As seen in indicator 0.1.2, residents here are a bit older than the medians of the U.S. and Washington. 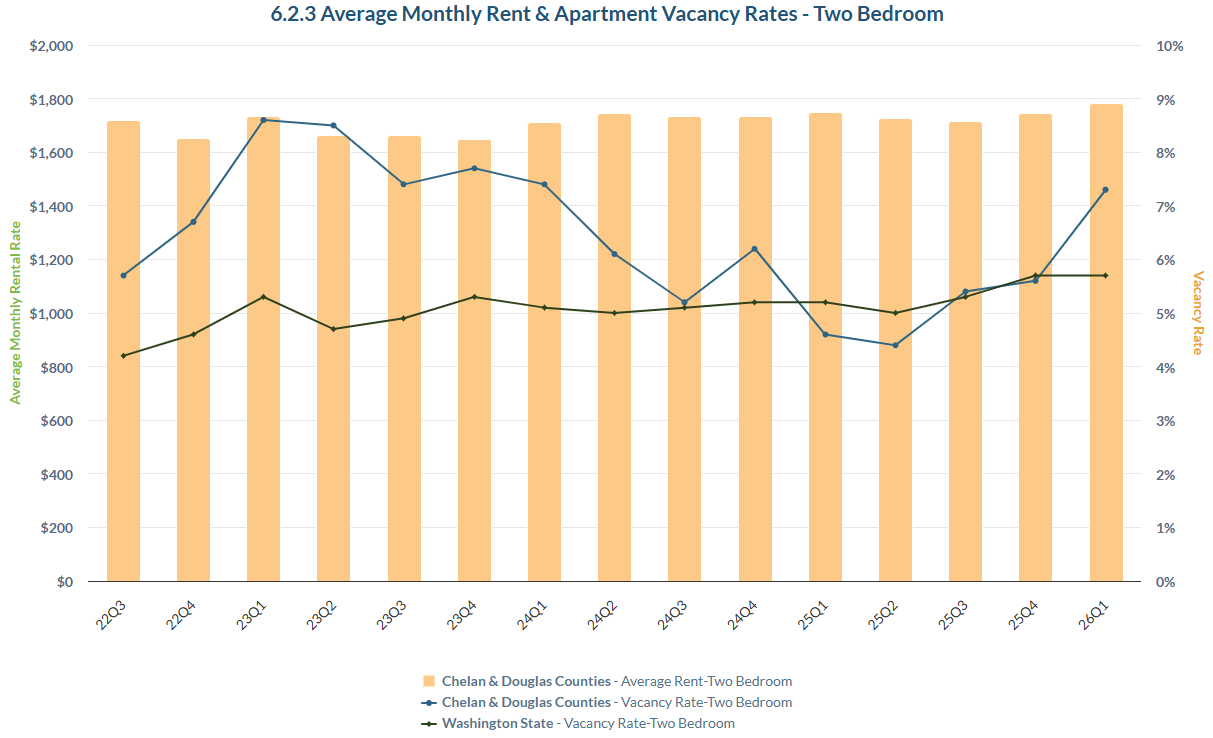
The most recent survey taken by the Washington Real Estate Research Center, from the first quarter of this year, puts the average rent for this size a unit at $1,782 in the two counties. That is up a bit (2%) from a year ago and 3% from three years ago.
The Center’s data reveal that vacancy rates for 2BR apartments here have been higher than those statewide. For the most recent quarter, the rate was 7%. Generally, real estate economists view a 5% vacancy rate as one indicating equilibrium between supply and demand. 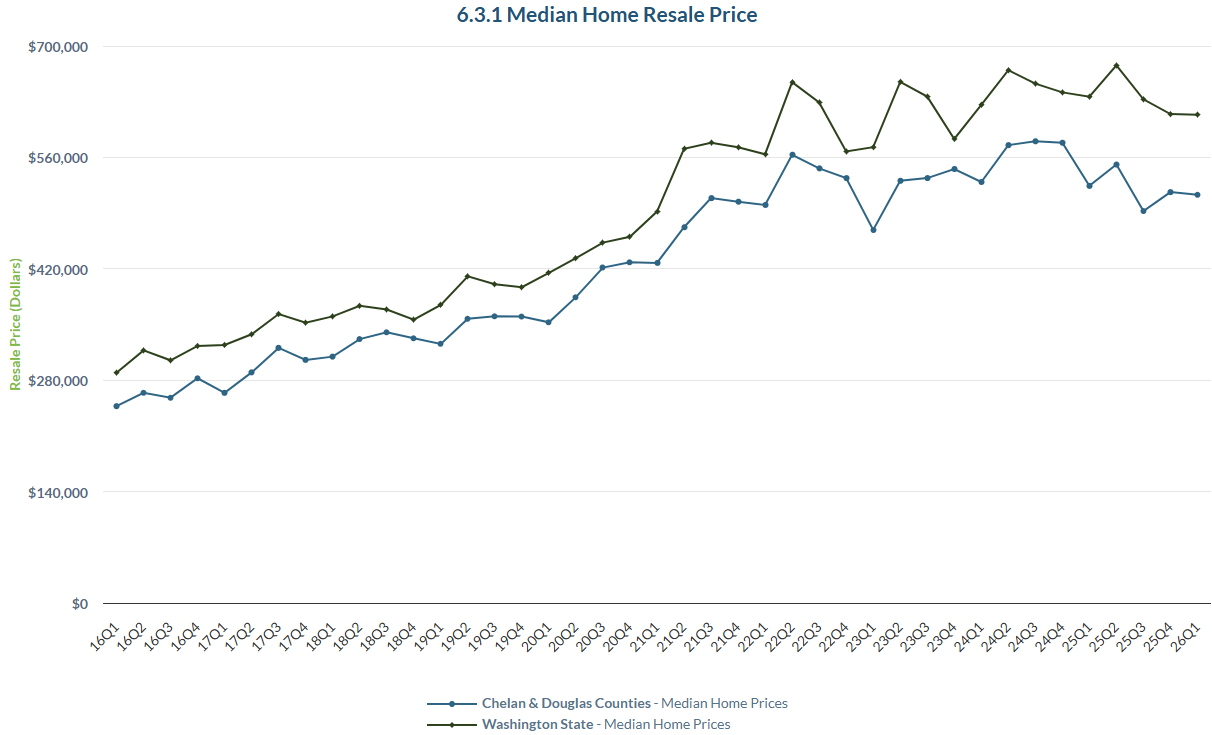
The area’s median house resale price has fallen for the past year but is still above $500,000.
Since the onset of the pandemic, the housing market in the two counties has been on a tear. In Q1 of 2020, the median price was approximately $353,000. (Note that this measure does not include new construction.) Within two years and one quarter, it breached $563,000, or a gain of nearly $100,000 per year!
But the last four quarters show an overall decline from the peak reached at the end of 2024 of $587,000. The most current reading, from Q4 of last year, was about $516,000. Note that this pattern largely resembles the run up seen statewide. Will this moderation continue - so that the median price falls below the half million mark?
In PUBLIC SAFETY: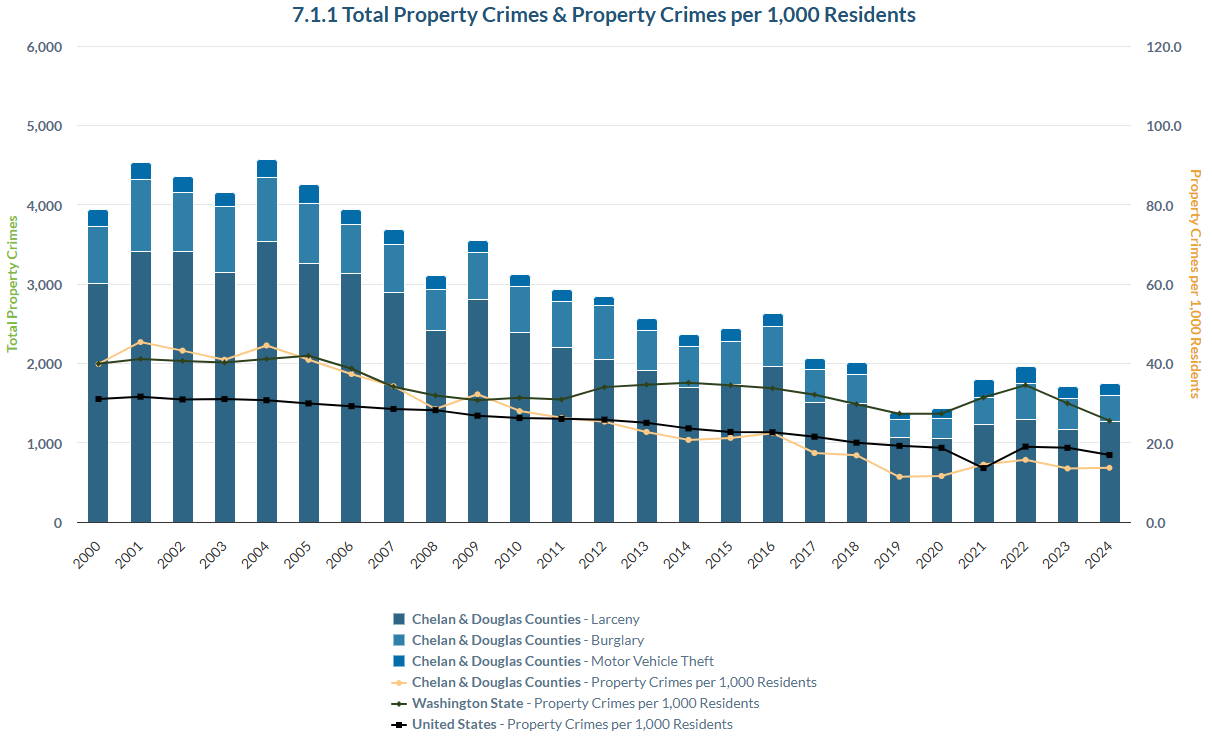
Property crime offenses in the two counties remain very low.
2024 data reveal that the two counties remain quite a safe environment for protecting one’s property. The total number of property crimes was the fourth lowest since the turn of the century, with 1,744 offenses reported to law enforcement, or a rate of 13.7 per 1,000 residents. A decade prior, the total was 2,436, yielding a much higher rate, 21.1 per 1,000 residents.
Peak numbers occurred in 2004, when a total of 4,570 property crimes were reported to authorities, for a rate of 44.5 per 1,000 residents. The year with the lowest numbers was 2019. With one exception, property crime in the two counties has been scarcer than the U.S. since 2011. And with one exception, the property crime rate here has been less than the state rate since 2004 and is currently much less.
Updated 5.21.2026
The complete list of Chelan-Douglas Trends can be found here.